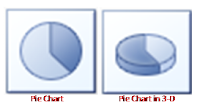
Pie charts
All Data that are arranged in one row or column only can be
plotted in a pie chart. These Pie charts displays the size of items
in one data series, relatively to the sum of the items.
You should consider using a pie chart when you only have one data series that you desire to plot.
and when none of the values are
negative. You can also plot a chart
when almost none of the values are zero and when you don’t have more than seven
categories to plot.
You can also consider plotting this
type of chart when the categories
represent parts of the whole pie.
Pie charts - subtypes
· Pie and pie in 3-D
This type of Pie charts displays the donation of each value to a total in a 2-D or 3-D format. Pie Chart gives
you ability to actually drag out the slices of a pie chart to emphasize them.
· Pie of pie and bar of pie
This very type, Pie of
pie or bar of pie charts displays
pie charts with user defined values detached
from the major pie chart and join into
a second pie or into a stacked bar. This chart types are useful if you want to make small slices in the main
pie chart easier to see.
· Exploded pie and exploded pie in 3-D
The exploded pie charts
show you the contribution of each value to a total while emphasizing individual
values. Exploded pie charts can be shown
in 3-D format since you cannot move the slices of an exploded pie separately. Consider using a pie or pie in 3-D chart instead. You can then drag out the slices
manually.


No comments:
Post a Comment